

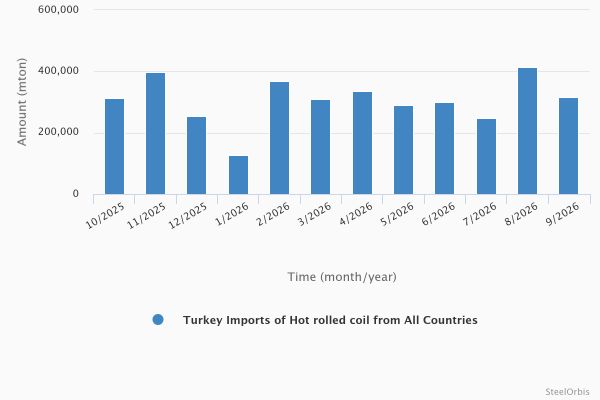
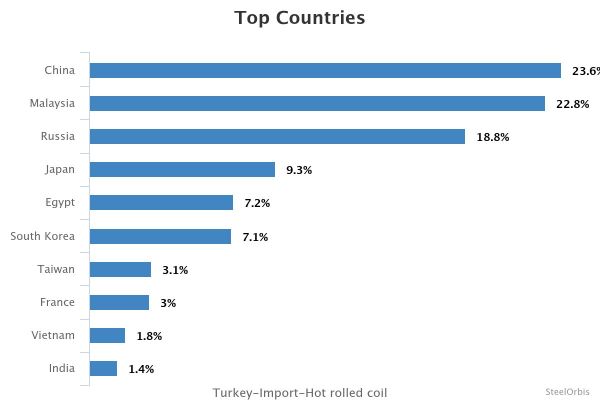
China remained Turkey’s largest supplier of hot-rolled coil (HRC) in January–September 2026, despite a steep drop in shipments. Malaysia rose to second place after increasing deliveries fivefold.
Turkey imported 2.71 million metric tons of HRC in the first nine months, down 7.4% year on year, according to preliminary data from the Turkish Statistical Institute (TÜİK). The value of imports fell 4.7% to $1.53 billion.
China supplied 639,991 metric tons, down 43.5% year on year. Malaysia shipped 617,454 metric tons, up 500.3% from the same period in 2025. Russia ranked third with 510,260 metric tons, a decline of 28.3%.
HRC imports totaled 317,024 metric tons in September, down 23.3% from August and 14.0% from a year earlier. Following a rebound in August, the cumulative decline widened to 7.4% in January–September, from 6.5% in January–August. The value of September imports was $191.88 million, down 20.9% month on month and 2.7% year on year.
September shipments from Malaysia doubled year on year to 148,570 metric tons, while imports from Russia plunged 99.1% to 1,013 metric tons. Japan’s deliveries rose 78.7% in the nine-month period to 251,701 metric tons. South Korean shipments were down 20.0% cumulatively, although they more than doubled in September. Vietnam entered the top 10 suppliers, with all 49,040 metric tons recorded in September. Imports from Egypt fell 98.2% year on year during the month.
| Country | Amount (mt) | |||||
| January-September 2026 | January-September 2025 | Y-o-y change (%) | September 2026 | September 2025 | Y-o-y change (%) | |
| China | 639,991 | 1,132,838 | -43.5 | 65,573 | 85,172 | -23.0 |
| Malaysia | 617,454 | 102,863 | 500.3 | 148,570 | 74,283 | 100.0 |
| Russia | 510,260 | 711,428 | -28.3 | 1,013 | 112,763 | -99.1 |
| Japan | 251,701 | 140,827 | 78.7 | 20,624 | - | - |
| Egypt | 194,269 | 344,964 | -43.7 | 900 | 51,112 | -98.2 |
| S. Korea | 191,266 | 239,155 | -20.0 | 21,683 | 9,320 | 132.6 |
| Taiwan | 84,399 | 39,687 | 112.7 | - | - | - |
| France | 81,139 | 94,353 | -14.0 | 7,986 | 9,716 | -17.8 |
| Vietnam | 49,040 | - | - | 49,040 | - | - |
| India | 38,737 | 5 | >1000.0 | - | - | - |
September figures showed a sharp monthly shift: arrivals from Malaysia, Vietnam, Japan and South Korea increased, while imports from Russia and Egypt nearly disappeared.




There are no comments yet.